Signals AI Canvas
Overview
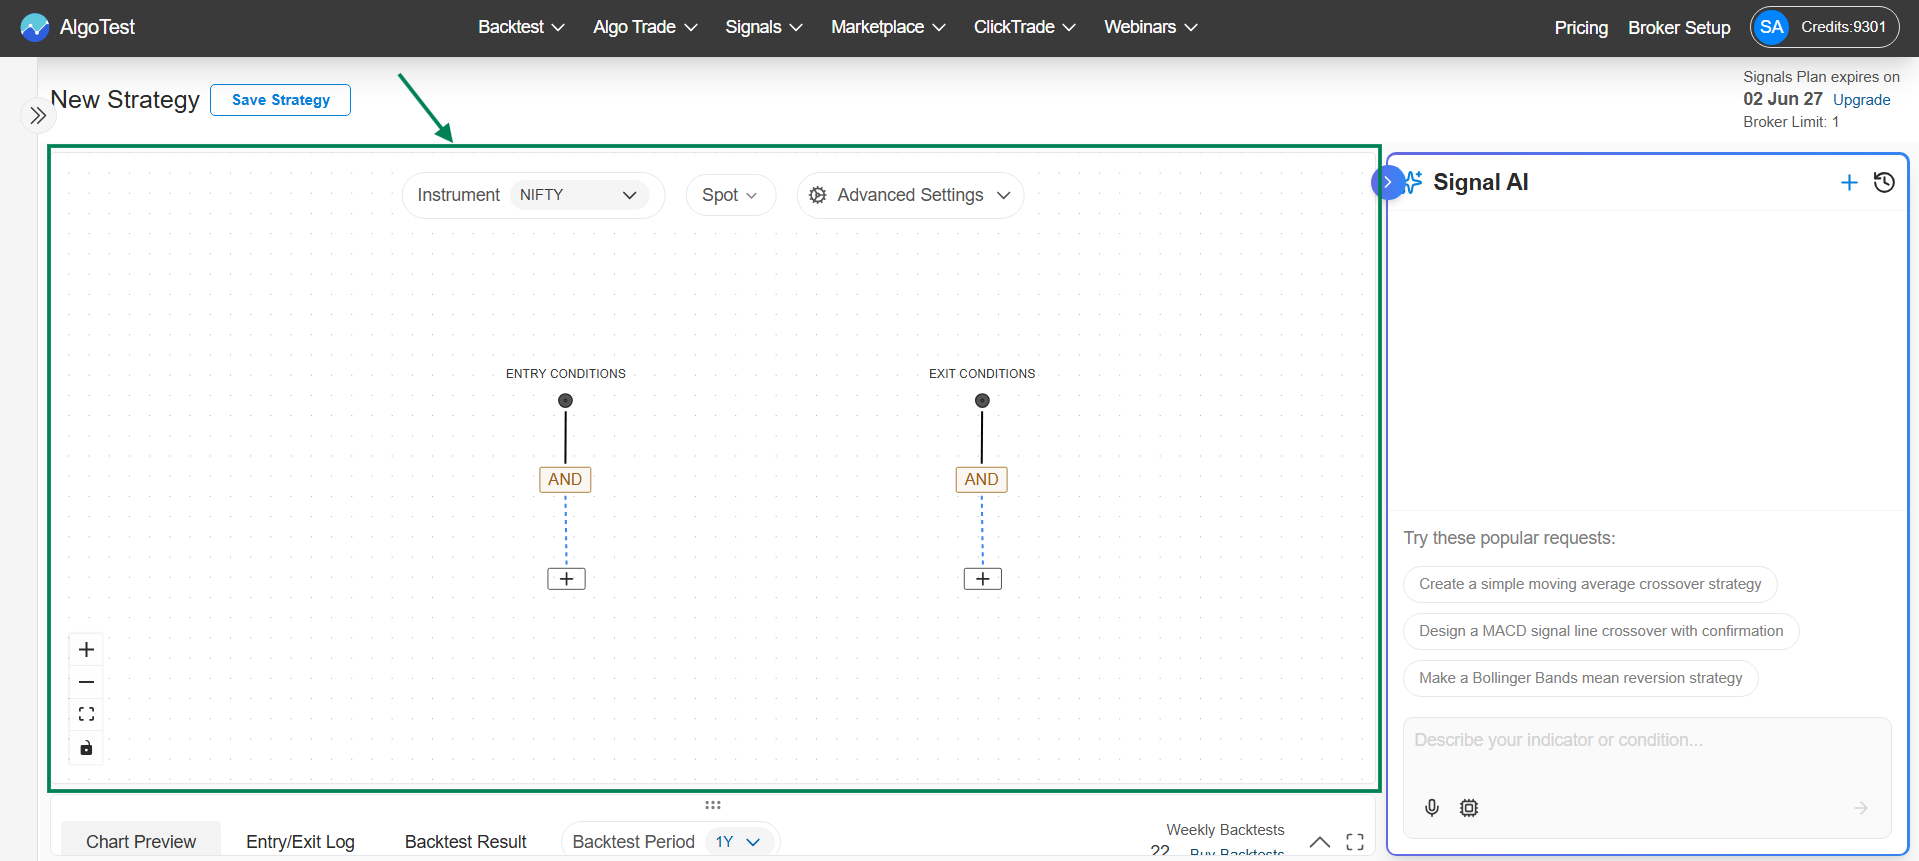
Signal AI Canvas allows users to create Indicator-based strategies by defining entry and exit conditions using different nodes and settings. It provides a flexible way to build, test, and execute trading strategies without coding.
1. Canvas Sections
→ Entry and Exit Conditions
-
Entry Conditions
These define when a trade should be entered. When the conditions set using nodes and indicators become true, the strategy generates a buy/sell signal. -
Exit Conditions
These define when a trade should be exited. When the exit conditions become true, the strategy closes the existing position.
Both Entry and Exit conditions are created using the same nodes and logic, only the purpose differs - one is for entering a trade and the other is for exiting it.
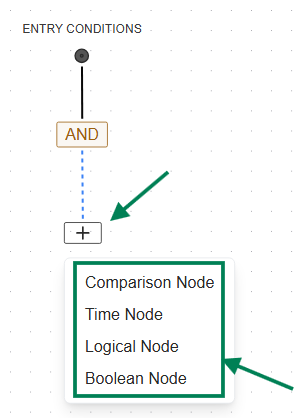
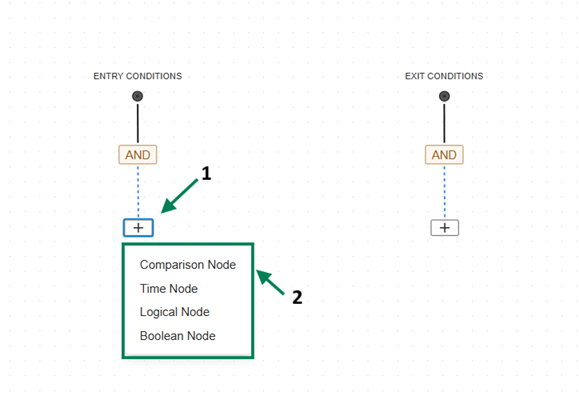
2. Nodes: A node is a building block in the strategy canvas used to define conditions and logic for entry and exit signals
Types of Nodes: There are 4 types of Nodes.
1. Logical Node
2. Comparison Node
3. Time Node
4. Boolean Node

→ Let’s look at the Nodes in detail
1. Logical Node
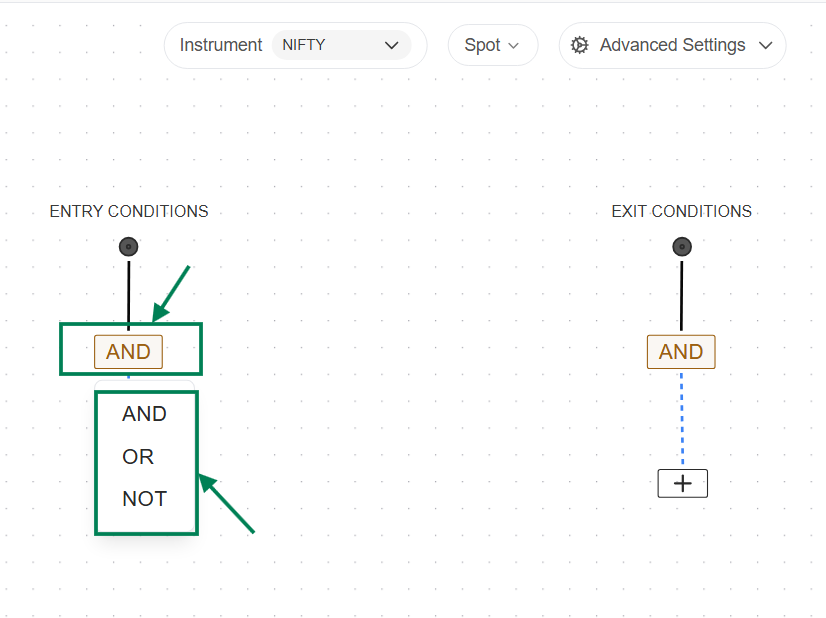
A Logical Node is used to combine multiple conditions together to form a complete strategy rule. It helps you control how different conditions should work together.
AND: All conditions must be true
OR: Any one condition can be true
NOT: Reverses a condition
Example: EMA 20 > EMA 50 AND RSI < 60 → Trade will trigger only when both conditions are true.\
→ Let’s see the procedure to select the Logical Node.
By default, an AND node is available in both Entry and Exit conditions.
You can select the Logical Node by clicking on the AND node, where a dropdown will appear and you can choose the required option (AND/OR/NOT). Alternatively, click on the “+” icon in the conditions, select Logical Node, and by default AND will be selected—you can click on it and change as needed.
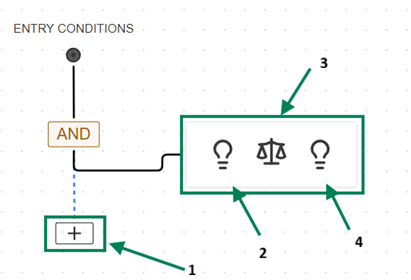
2. Comparison Node
Used to compare two indicators or values to define entry or exit conditions. It helps determine when one value is greater, smaller, equal, or crossing another.
Includes:
-
Two indicator/value inputs
-
One comparison operator
Supported Indicators:
EMA, SMA, RSI, MACD, ADX, ATR, Bollinger Bands, VWAP, VWMA, WMA, Stochastic, Supertrend, ROC, Williams %R, Special K, Min Max, Candle, etc.
Comparison Operators:
-
Greater Than (>)
-
Less Than (<)
-
Equal / Not Equal
-
Greater Than or Equal To / Less Than or Equal To
-
Crosses Above
-
Crosses Below
You can select any two indicators or values and define how they should be compared. For example, EMA 20 crosses above EMA 50 or RSI > 60. Based on this condition, the strategy will generate entry or exit signals.
\
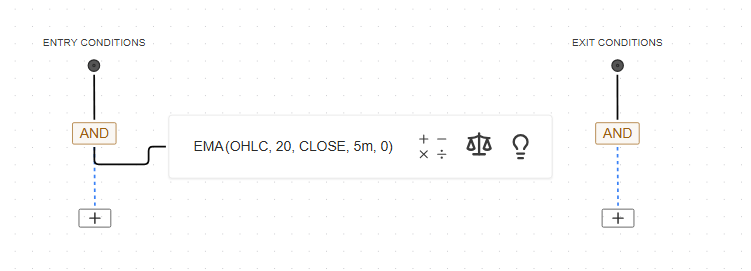
→ Let’s see the procedure to select the Comparison Node.
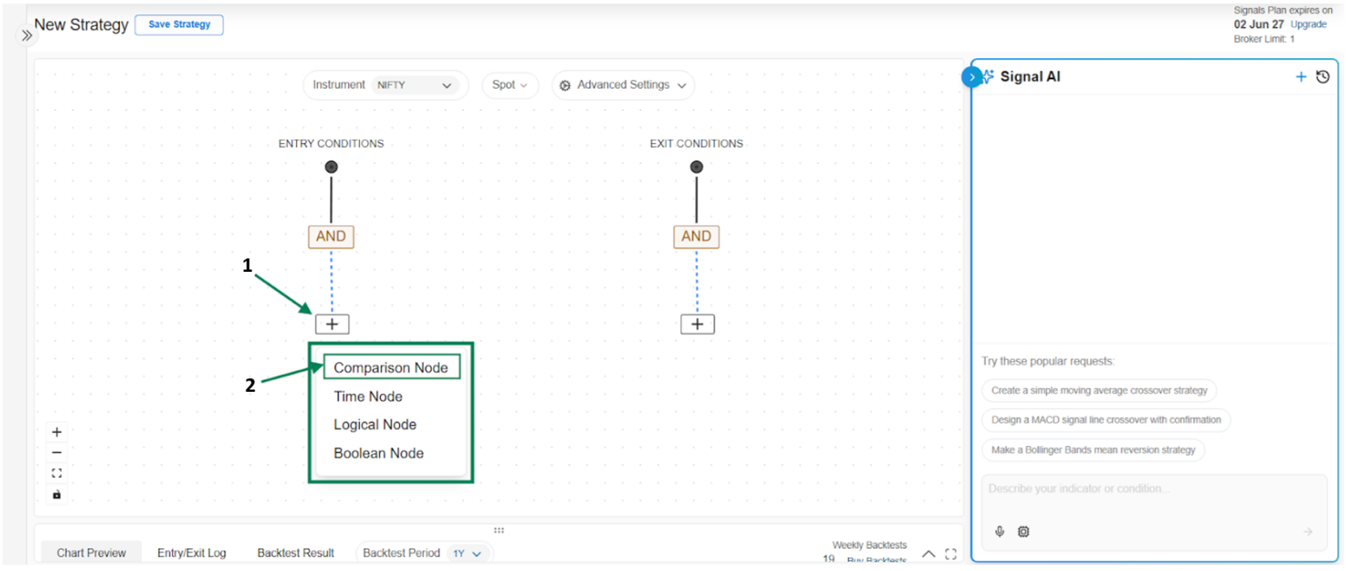
Click on the “+” icon under Entry or Exit conditions and select Comparison Node. Then choose Indicators in both input sections and select the required comparison operator (>, <, Crosses Above, Crosses Below, etc.) from the dropdown to define the condition.\

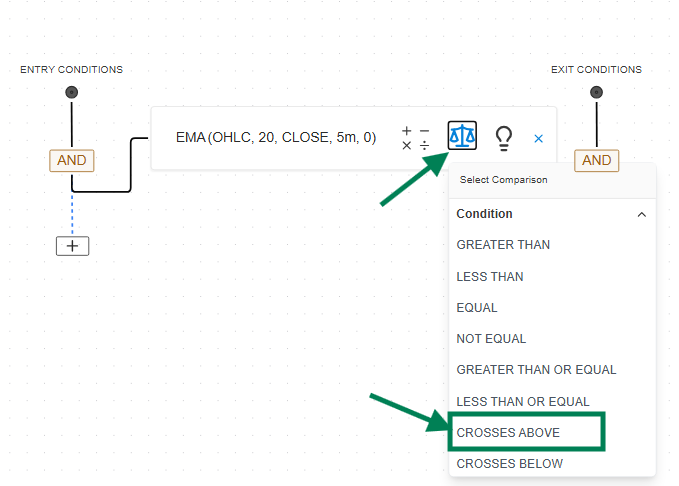
**→ Steps to Create a EMA 20/50 Cross Over Signal based Condition using comparison Node **
- On Entry Condition, click on “+” and select Comparison Node
- Search and select the EMA indicator
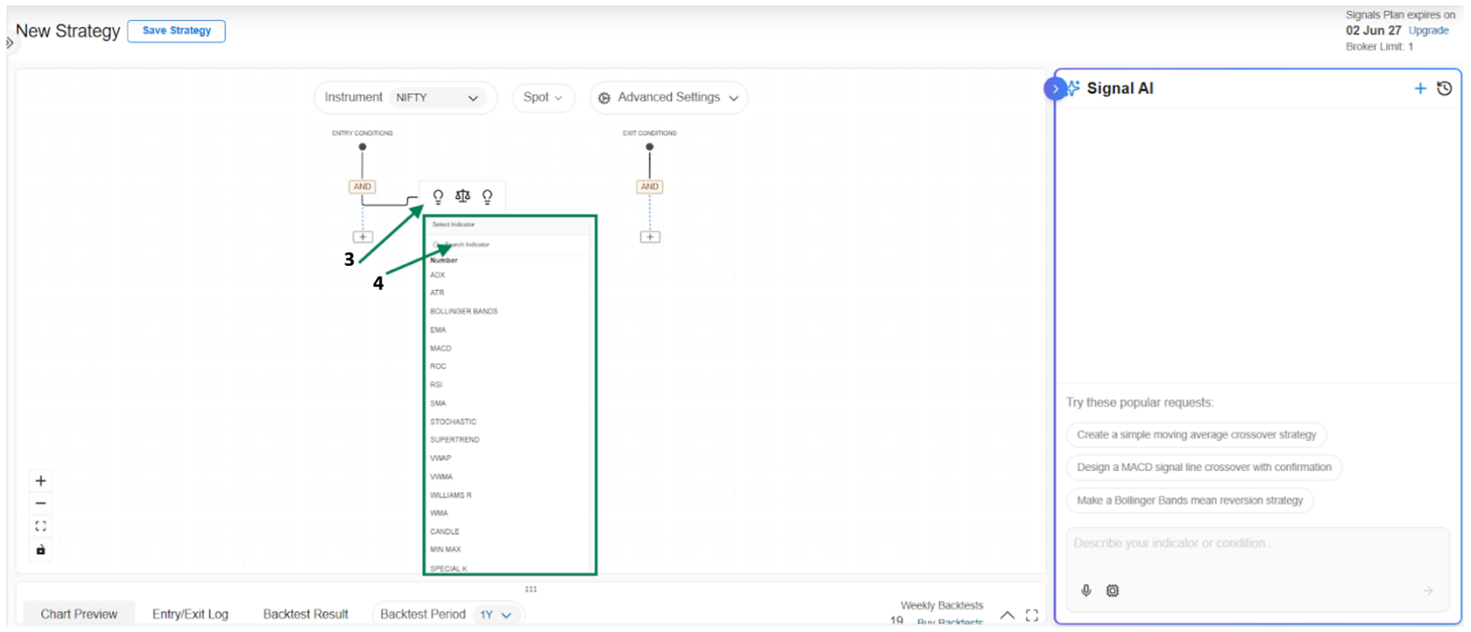
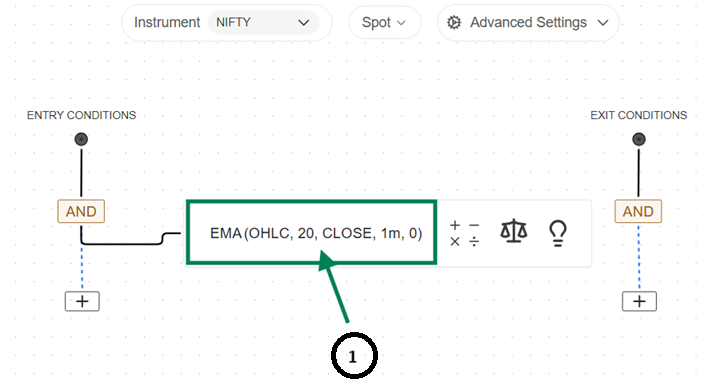
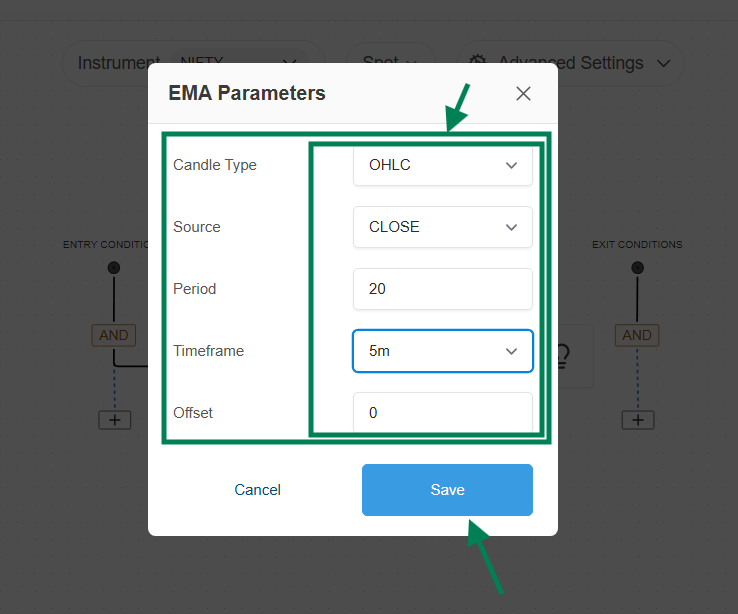
- Click and Set Fast EMA Indicator Input Settings and save
- Add comparison → select “Crosses Above”
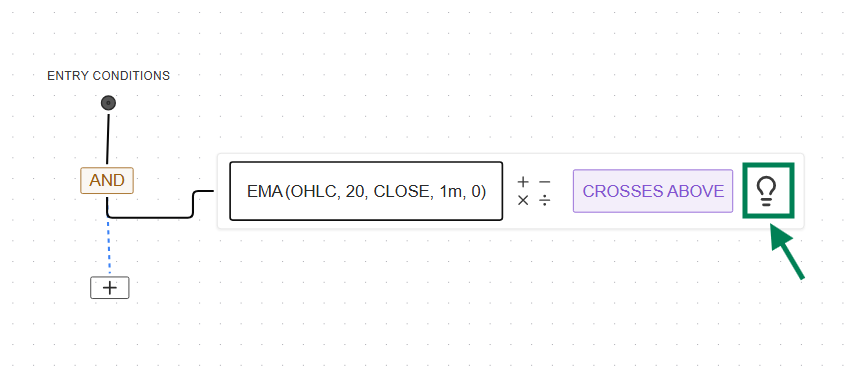
- Follow the same process for Slow EMA 50.
→ Search and select EMA, then set Indicator settings accordingly EMA 50 and save.


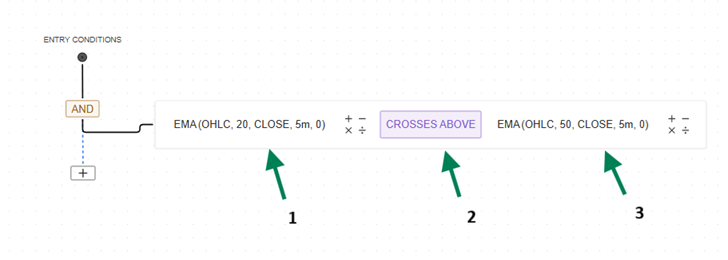
→ After Selection, here’s how it looks like
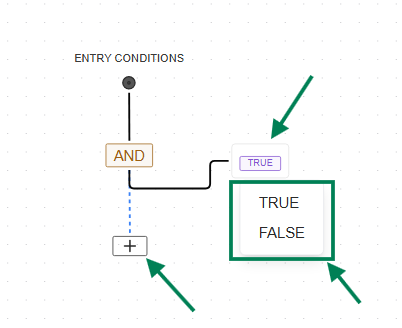
3. Boolean Node
Used to define fixed conditions in the strategy. It allows you to directly set a condition as TRUE or FALSE without using any indicator.
Includes:
- One value selection (TRUE / FALSE)
\
→ Let’s see the procedure to select the Boolean Node.
Click on the “+” icon under Entry or Exit conditions and select Boolean Node. Then choose the required value (TRUE or FALSE) from the dropdown to define the condition.
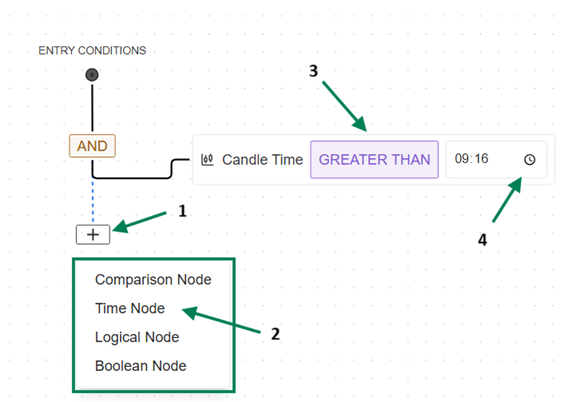
4. Time Node
Used to define time-based conditions in the strategy. It allows you to trigger entry or exit conditions based on specific market time.
Includes:
-
Candle Time selection
-
Comparison operators (Greater Than, Less Than, Equal To, etc.)
-
Time input (HH:MM format)
→ Let’s see the procedure to select the Time Node.
Click on the “+” icon under Entry or Exit conditions and select Time Node. Then choose the required condition (e.g., Candle Time > 09:16) and set the desired time to define when the strategy should trigger.
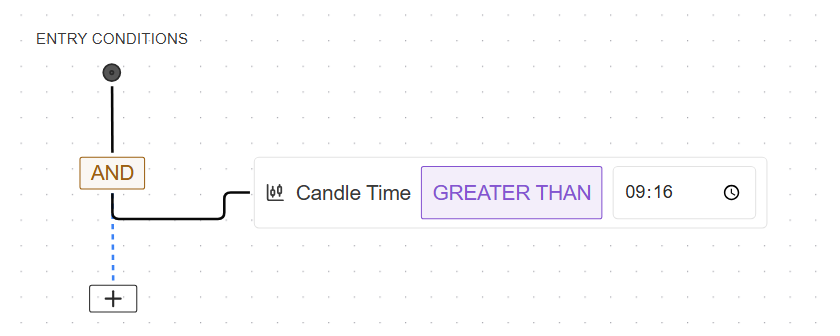
**→ After settings, here's how it looks. **
Strategy Creation Workflow
Step 1: Select Instrument
-
Choose instrument from dropdown
-
Example: NIFTY
**Step 2: Data Section **
-
On which Data you want to Apply the Indicator Condition
-
Example: NIFTY Spot or Nifty Future or Nifty Options etc..
Step 3: Advance Data Settings.
-
You can define the Max Concurrent Signals
-
You can define the Max Signals in a Day
Step 5: Create Entry Condition
-
Click “+” under Entry Conditions
-
Select Comparison Node
Example Condition: RSI crosses above 30
-
Indicator: RSI
-
Period: 14
-
Operator: Crosses Above
-
Value: 30
Entry signal is generated when RSI crosses above 30
Step 6: Create Exit Condition
-
Click “+” under Exit Conditions
-
Select Comparison Node
Example Condition: RSI crosses above 70
-
Indicator: RSI
-
Period: 14
-
Operator: Crosses Above
-
Value: 70
Exit signal is generated when RSI crosses above 70
7. Additional Capability
-
Strategies can be created:
-
Using Signal AI Agent (chat input)
-
Using Canvas manually
-
Or a combination of both
\
-
Note: Proper use of nodes, indicators, and settings helps in building accurate and effective trading strategies.
\